内存Memory占用是不是不准确 #46

Closed
opened 2026-01-15 11:37:03 +08:00 by yan · 3 comments
Owner

Originally created by @mengdodo on GitHub (Dec 23, 2020).

  • OS:debian9
  • PHP version: php-8.0.0-fpm-alpine

docker stats (host)

CONTAINER ID        NAME                CPU %               MEM USAGE / LIMIT     MEM %               NET I/O             BLOCK I/O           PIDS
895fe601792d        mengdodo_php        0.04%               30.09MiB / 7.666GiB   0.38%               8.7MB / 32.2MB      0B / 8.19kB         4

top (host)

Tasks: 109 total,   1 running, 108 sleeping,   0 stopped,   0 zombie
%Cpu(s):  0.0 us,  1.6 sy,  0.0 ni, 98.4 id,  0.0 wa,  0.0 hi,  0.0 si,  0.0 st
MiB Mem :   7850.4 total,   4378.0 free,    457.2 used,   3015.2 buff/cache
MiB Swap:      0.0 total,      0.0 free,      0.0 used.   7042.0 avail Mem

x.php (X-Prober 6.5)

image

question

根据我观察,x.php显示内存一直在上涨,从一开始的690M,到700M,到现在的800M,且跟宿主机内存占用不匹配,请问这是个BUG吗,还是我观察的方式不对。
@kmvan According to my observation, x.php shows that the memory has been rising, from 690m at the beginning, to 700m, to 800m now, and it does not match the host's memory occupation. Is this a bug, or is the way I observe wrong ?

Originally created by @mengdodo on GitHub (Dec 23, 2020). - OS:debian9 - PHP version: php-8.0.0-fpm-alpine ### docker stats (host) ``` CONTAINER ID NAME CPU % MEM USAGE / LIMIT MEM % NET I/O BLOCK I/O PIDS 895fe601792d mengdodo_php 0.04% 30.09MiB / 7.666GiB 0.38% 8.7MB / 32.2MB 0B / 8.19kB 4 ``` ### top (host) ``` Tasks: 109 total, 1 running, 108 sleeping, 0 stopped, 0 zombie %Cpu(s): 0.0 us, 1.6 sy, 0.0 ni, 98.4 id, 0.0 wa, 0.0 hi, 0.0 si, 0.0 st MiB Mem : 7850.4 total, 4378.0 free, 457.2 used, 3015.2 buff/cache MiB Swap: 0.0 total, 0.0 free, 0.0 used. 7042.0 avail Mem ``` ### x.php (X-Prober 6.5) ![image](https://user-images.githubusercontent.com/21698573/102991890-1ada8f80-4555-11eb-9504-79766cb85557.png) ### question 根据我观察,x.php显示内存一直在上涨,从一开始的690M,到700M,到现在的800M,且跟宿主机内存占用不匹配,请问这是个BUG吗,还是我观察的方式不对。 @kmvan According to my observation, x.php shows that the memory has been rising, from 690m at the beginning, to 700m, to 800m now, and it does not match the host's memory occupation. Is this a bug, or is the way I observe wrong ?
yan added the question label 2026-01-15 11:37:03 +08:00
yan closed this issue 2026-01-15 11:37:04 +08:00
Author
Owner

@kmvan commented on GitHub (Dec 23, 2020):

cat一下 /proc/meminfo 看看

@kmvan commented on GitHub (Dec 23, 2020): cat一下 `/proc/meminfo` 看看
Author
Owner

@mengdodo commented on GitHub (Dec 24, 2020):

cat一下 /proc/meminfo 看看

@kmvan
现在时间:12:13分

X-Prober显示内存占用:810.68 M / 7.67 G

root@VM-0-17-debian:~# cat /proc/meminfo
MemTotal:        8038800 kB
MemFree:         4460352 kB
MemAvailable:    7209004 kB
Buffers:          206572 kB
Cached:          2571136 kB
SwapCached:            0 kB
Active:          1661972 kB
Inactive:        1470624 kB
Active(anon):     327152 kB
Inactive(anon):    82348 kB
Active(file):    1334820 kB
Inactive(file):  1388276 kB
Unevictable:           0 kB
Mlocked:               0 kB
SwapTotal:             0 kB
SwapFree:              0 kB
Dirty:               140 kB
Writeback:             0 kB
AnonPages:        354456 kB
Mapped:           161548 kB
Shmem:             85924 kB
Slab:             386504 kB
SReclaimable:     330552 kB
SUnreclaim:        55952 kB
KernelStack:        3056 kB
PageTables:         3980 kB
NFS_Unstable:          0 kB
Bounce:                0 kB
WritebackTmp:          0 kB
CommitLimit:     4019400 kB
Committed_AS:    1704284 kB
VmallocTotal:   34359738367 kB
VmallocUsed:           0 kB
VmallocChunk:          0 kB
Percpu:             1712 kB
HardwareCorrupted:     0 kB
AnonHugePages:    153600 kB
ShmemHugePages:        0 kB
ShmemPmdMapped:        0 kB
HugePages_Total:       0
HugePages_Free:        0
HugePages_Rsvd:        0
HugePages_Surp:        0
Hugepagesize:       2048 kB
Hugetlb:               0 kB
DirectMap4k:      132976 kB
DirectMap2M:     4061184 kB
DirectMap1G:     6291456 kB
root@VM-0-17-debian:~#
@mengdodo commented on GitHub (Dec 24, 2020): > cat一下 `/proc/meminfo` 看看 @kmvan 现在时间:12:13分 X-Prober显示内存占用:810.68 M / 7.67 G ``` root@VM-0-17-debian:~# cat /proc/meminfo MemTotal: 8038800 kB MemFree: 4460352 kB MemAvailable: 7209004 kB Buffers: 206572 kB Cached: 2571136 kB SwapCached: 0 kB Active: 1661972 kB Inactive: 1470624 kB Active(anon): 327152 kB Inactive(anon): 82348 kB Active(file): 1334820 kB Inactive(file): 1388276 kB Unevictable: 0 kB Mlocked: 0 kB SwapTotal: 0 kB SwapFree: 0 kB Dirty: 140 kB Writeback: 0 kB AnonPages: 354456 kB Mapped: 161548 kB Shmem: 85924 kB Slab: 386504 kB SReclaimable: 330552 kB SUnreclaim: 55952 kB KernelStack: 3056 kB PageTables: 3980 kB NFS_Unstable: 0 kB Bounce: 0 kB WritebackTmp: 0 kB CommitLimit: 4019400 kB Committed_AS: 1704284 kB VmallocTotal: 34359738367 kB VmallocUsed: 0 kB VmallocChunk: 0 kB Percpu: 1712 kB HardwareCorrupted: 0 kB AnonHugePages: 153600 kB ShmemHugePages: 0 kB ShmemPmdMapped: 0 kB HugePages_Total: 0 HugePages_Free: 0 HugePages_Rsvd: 0 HugePages_Surp: 0 Hugepagesize: 2048 kB Hugetlb: 0 kB DirectMap4k: 132976 kB DirectMap2M: 4061184 kB DirectMap1G: 6291456 kB root@VM-0-17-debian:~# ```
Author
Owner

@kmvan commented on GitHub (Dec 24, 2020):

看起来没错,

MemTotal:        8038800 kB
MemFree:         4460352 kB
MemAvailable:    7209004 kB
Buffers:          206572 kB
Cached:          2571136 kB

MemTotal - MemAvailable = 即为真实内存使用(不包含缓存)。
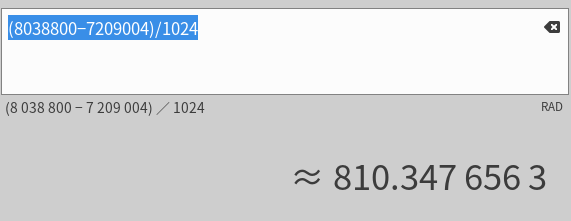
image

这个是debian系的计算。

@kmvan commented on GitHub (Dec 24, 2020): 看起来没错, ``` MemTotal: 8038800 kB MemFree: 4460352 kB MemAvailable: 7209004 kB Buffers: 206572 kB Cached: 2571136 kB ``` MemTotal - MemAvailable = 即为真实内存使用(不包含缓存)。 ![image](https://user-images.githubusercontent.com/3839554/103060162-35a71580-45e2-11eb-8d17-c266d7c11721.png) 这个是debian系的计算。
Sign in to join this conversation.
1 Participants
Notifications
Due Date
No due date set.
Dependencies

No dependencies set.

Reference: yan/archived-x-prober#46